|
Published: 30 September 2013
Raijin supercomputer cooks up a storm
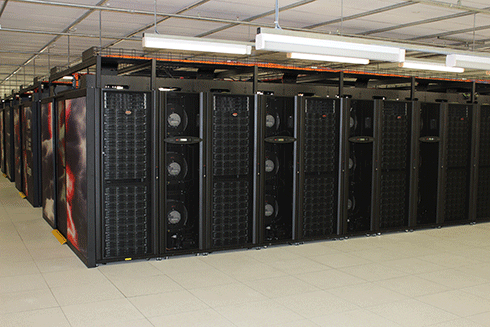
Australia’s most powerful supercomputer is christened Raijin, the name of the Japanese god of thunder, lightning and storms. Fittingly, its main role will be processing data for the earth and atmospheric sciences, as well as for applications in photonics, astrophysics, materials chemistry and microbiology.
Rather than being measured in megabits or gigabits-per-second, supercomputer performance is measured in Floating Operations Per Second, or Flops. Raijin has a peak performance of 1.2 PetaFlops – in other words it is capable of executing 1200 trillion (one million million) calculations per second.
To put this in perspective, Raijin can perform in one hour the number of calculations the entire population of Earth, armed with calculators, could carry out over 20 years.
This is exactly the sort of processing power scientists need to build and test complex climate models that can more closely mimic real-world complexities.
The ocean, for example, plays an important role in the Earth’s climate. ‘It’s a big reservoir of heat,’ says Dr Andy Hogg from the ARC Centre of Excellence for Climate Systems Science.
‘In that way it slows down the rate of climate change. It’s also important as the ocean absorbs carbon dioxide from the atmosphere.’
Dr Hogg is particularly interested in the Southern Ocean. This circumpolar mass of water was initially seen as a source of atmospheric carbon – carbon-rich deep water that flowed to the surface released its dissolved carbon dioxide into the atmosphere as a result of the pressure difference. In fact, the carbon dioxide released from the Southern Ocean probably played a role in the end of the last Ice Age.
‘Unfortunately the Southern Ocean is not well represented in the climate models,’ explains Hogg. ‘We need finer resolution to improve the models, but this is limited by computer power.’
This ‘finer resolution’ refers to ocean eddies. Eddies are an important aspect of understanding the dynamics of all oceans, and play an important role in both the transfer of heat and the carbon cycle. This is the case for the Southern Ocean, with one key difference: the eddies of the Southern Ocean are three to five times smaller than those in other oceans.
In order to model these smaller eddies, a supercomputer is needed.
‘The computer chips aren’t getting much faster so what we have to do is use more of them,’ says Hogg.
This is where Raijin comes in. The increased computing power offered by Raijin will allow better models for the Southern Ocean’s heat and carbon cycles. This in turn will result in better weather and climate forecasts.1
Virtual labs
Launched in July, the 70-tonne Raijin is located at the National Computational Infrastructure (NCI) high-performance computing centre at the Australian National University (ANU) in Canberra.
NCI provides high-end services to Australia’s researchers, with the aim of ‘raising the ambition, impact, and outcomes of Australian research through access to advanced computational and data-intensive methods, support, and high-performance infrastructure’.
The initiative is a formal collaboration between ANU, CSIRO, the Australian Bureau of Meteorology and Geoscience Australia, as well as partnerships with some universities, and support from the Australian Research Council. The NCI and Raijin are supported by the Australian Government’s Super Science Initiative.
By being able to access Raijin using secure internet connections, researchers from across Australia are developing ‘virtual laboratories’ of models and simulations they can open to a wider audience of researchers.
One of these is being set up by the Centre for Australian Weather and Climate Research (CAWCR), a partnership between CSIRO and the Bureau.
CAWCR is developing an Australian Community Climate and Earth System Simulator or ACCESS, which brings together six different earth system simulations that include atmospheric chemistry, oceans, sea-ice and heat circulation. Given the scale and complexity of this large-scale, multi-system simulation, ACCESS can only be run on a supercomputer like Raijin.
CAWCR hopes ACCESS will improve weather and climate forecasts, including 10-year forecast intervals, which have so far proved difficult to estimate accurately. ACCESS will also improve climate models for the Southern Hemisphere, which will in turn help improve global models, including those of the IPCC.
To make ACCESS’s outputs more readily available to interested researchers, particularly those who may be unfamiliar with working with such simulations, the Bureau is partnering with the National eResearch Collaboration Tools and Resources (NeCTAR) project.
The goal is to develop a Climate and Weather Science Laboratory, where users can access the results of ACCESS’s Raijin simulations via a web portal. This will increase the numbers of researchers able to access supercomputer functionality.
Other virtual laboratories supported by NeCTAR include the CSIRO Virtual Geophysics Laboratory, the All Sky Virtual Observatory and the University of Tasmania Marine Virtual Laboratory.
1 Climate and weather are the two aspects of meteorology. Weather is a description of conditions over a short period - a snapshot of the atmosphere at a particular time. Climate, on the other hand, is the sum or synthesis of all the weather recorded over a long period. It tells us the average/most common conditions (e.g. mean temperature, prevailing wind) or extremes (highest rainfall, strongest wind) or counts of events (number of rainy days) or probabilities (how likely are three consecutive hot days in January?). See Bureau of Meteorology’s website for further explanation.


